Rufous Fantail
Rhipidura rufifrons
ABR description
The following is extracted from the Annual Bird Report for the twelve months to June 2017.
Uncommon, breeding summer migrant
A summer migrant to the ranges in the ACT, sometimes observed passing through the suburbs.
General: The reporting rate of 0.4% is down 32% on the 10YA and down 54% the 30YA. The reporting rate has varied over the years, but the trend has been downward from 1993 to the present day, where the rate is the second lowest it has ever has been. Most records were in summer 59% and autumn 26%. Maximum 7/20 Feb Tallaganda SF north GrV19 (LaK1). Earliest record: 1/22 Oct West Goulburn Bushland Reserve GrY01 (AnF1) and latest 1/6 Apr Cook (DeB3). The 2 breeding records were on/15 Feb NNP Warks/Blundells Ck Rds GrE15 (CoF1) and dy/6 Mar TNR Lyrebird Trail GrF17 (LaK1). There have only been breeding records in 9 of the last 31 years (last in 2005).
GBS: 1 record 1/3wk Mar Curtin (MoM3).

Abundance
Abundance is the average number of birds of that species per survey. Where the species was observed (presence recorded) but the number of birds seen was not recorded, this is treated as a count of zero.
Abundance by year
This chart shows the abundance of Rufous Fantail between 1982 and 2017. 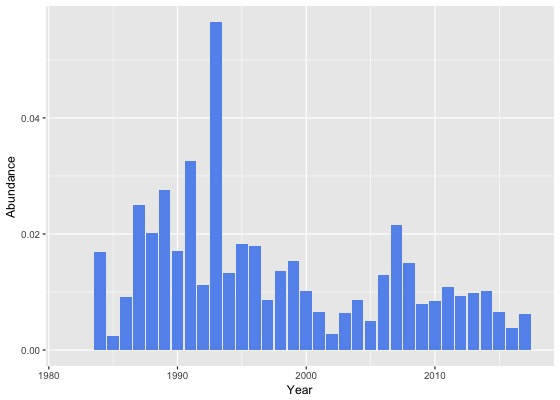
Abundance by month
This chart shows the monthly abundance of Rufous Fantail. The blue lines show the abundance for the twelve months to June 2017 and the bars show the average abundance for the period 1982 to 2017. 
Abundance by season
This chart shows the seasonal abundance of Rufous Fantail. The blue lines show the seasonal abundance for the twelve months to June 2017 and the bars show the average seasonal abundance for the period 1982 to 2017. 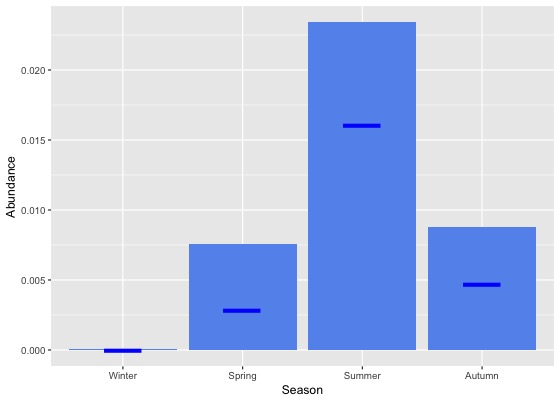
Abundance data
| Month | Season | ||||||||||||||||||
|---|---|---|---|---|---|---|---|---|---|---|---|---|---|---|---|---|---|---|---|
| Period | Jul | Aug | Sep | Oct | Nov | Dec | Jan | Feb | Mar | Apr | May | Jun | Winter | Spring | Summer | Autumn | All | ||
| All years | |||||||||||||||||||
| All | 0.0 | 0.0 | 0.0 | 0.0 | 0.0 | 0.0 | 0.0 | 0.0 | 0.0 | 0.0 | 0.0 | 0.0 | 0.0 | 0.0 | 0.0 | 0.0 | 0.0 | ||
| Previous years | |||||||||||||||||||
| All previous years | 0.0 | 0.0 | 0.0 | 0.0 | 0.0 | 0.0 | 0.0 | 0.0 | 0.0 | 0.0 | 0.0 | 0.0 | 0.0 | 0.0 | 0.0 | 0.0 | 0.0 | ||
| Previous 30 years | 0.0 | 0.0 | 0.0 | 0.0 | 0.0 | 0.0 | 0.0 | 0.0 | 0.0 | 0.0 | 0.0 | 0.0 | 0.0 | 0.0 | 0.0 | 0.0 | 0.0 | ||
| Previous 20 years | 0.0 | 0.0 | 0.0 | 0.0 | 0.0 | 0.0 | 0.0 | 0.0 | 0.0 | 0.0 | 0.0 | 0.0 | 0.0 | 0.0 | 0.0 | 0.0 | 0.0 | ||
| 10 year groups | |||||||||||||||||||
| [2007,2017) | 0.0 | 0.0 | 0.0 | 0.0 | 0.0 | 0.0 | 0.0 | 0.0 | 0.0 | 0.0 | 0.0 | 0.0 | 0.0 | 0.0 | 0.0 | 0.0 | 0.0 | ||
| [1997,2007) | 0.0 | 0.0 | 0.0 | 0.0 | 0.0 | 0.0 | 0.0 | 0.0 | 0.0 | 0.0 | 0.0 | 0.0 | 0.0 | 0.0 | 0.0 | 0.0 | 0.0 | ||
| [1987,1997) | 0.0 | 0.0 | 0.0 | 0.0 | 0.0 | 0.0 | 0.1 | 0.1 | 0.1 | 0.0 | 0.0 | 0.0 | 0.0 | 0.0 | 0.1 | 0.0 | 0.0 | ||
| 5 year groups | |||||||||||||||||||
| [2012,2017) | 0.0 | 0.0 | 0.0 | 0.0 | 0.0 | 0.0 | 0.0 | 0.0 | 0.0 | 0.0 | 0.0 | 0.0 | 0.0 | 0.0 | 0.0 | 0.0 | 0.0 | ||
| [2007,2012) | 0.0 | 0.0 | 0.0 | 0.0 | 0.0 | 0.0 | 0.1 | 0.0 | 0.0 | 0.0 | 0.0 | 0.0 | 0.0 | 0.0 | 0.0 | 0.0 | 0.0 | ||
| [2002,2007) | 0.0 | 0.0 | 0.0 | 0.0 | 0.0 | 0.0 | 0.0 | 0.0 | 0.0 | 0.0 | 0.0 | 0.0 | 0.0 | 0.0 | 0.0 | 0.0 | 0.0 | ||
| [1997,2002) | 0.0 | 0.0 | 0.0 | 0.0 | 0.0 | 0.0 | 0.0 | 0.0 | 0.0 | 0.0 | 0.0 | 0.0 | 0.0 | 0.0 | 0.0 | 0.0 | 0.0 | ||
| [1992,1997) | 0.0 | 0.0 | 0.0 | 0.0 | 0.0 | 0.0 | 0.1 | 0.0 | 0.1 | 0.0 | 0.0 | 0.0 | 0.0 | 0.0 | 0.0 | 0.0 | 0.0 | ||
| [1987,1992) | 0.0 | 0.0 | 0.0 | 0.0 | 0.0 | 0.0 | 0.0 | 0.1 | 0.0 | 0.0 | 0.0 | 0.0 | 0.0 | 0.0 | 0.1 | 0.0 | 0.0 | ||
| Year | |||||||||||||||||||
| 2017 | 0.0 | 0.0 | 0.0 | 0.0 | 0.0 | 0.0 | 0.0 | 0.0 | 0.0 | 0.0 | 0.0 | 0.0 | 0.0 | 0.0 | 0.0 | 0.0 | 0.0 | ||
| 2016 | 0.0 | 0.0 | 0.0 | 0.0 | 0.0 | 0.0 | 0.0 | 0.0 | 0.0 | 0.0 | 0.0 | 0.0 | 0.0 | 0.0 | 0.0 | 0.0 | 0.0 | ||
| 2015 | 0.0 | 0.0 | 0.0 | 0.0 | 0.0 | 0.0 | 0.0 | 0.0 | 0.0 | 0.0 | 0.0 | 0.0 | 0.0 | 0.0 | 0.0 | 0.0 | 0.0 | ||
| 2014 | 0.0 | 0.0 | 0.0 | 0.0 | 0.0 | 0.0 | 0.0 | 0.0 | 0.0 | 0.0 | 0.0 | 0.0 | 0.0 | 0.0 | 0.0 | 0.0 | 0.0 | ||
| 2013 | 0.0 | 0.0 | 0.0 | 0.0 | 0.0 | 0.0 | 0.0 | 0.1 | 0.0 | 0.0 | 0.0 | 0.0 | 0.0 | 0.0 | 0.0 | 0.0 | 0.0 | ||
| 2012 | 0.0 | 0.0 | 0.0 | 0.0 | 0.0 | 0.0 | 0.0 | 0.0 | 0.0 | 0.0 | 0.0 | 0.0 | 0.0 | 0.0 | 0.0 | 0.0 | 0.0 | ||
| 2011 | 0.0 | 0.0 | 0.0 | 0.0 | 0.0 | 0.0 | 0.0 | 0.0 | 0.0 | 0.0 | 0.0 | 0.0 | 0.0 | 0.0 | 0.0 | 0.0 | 0.0 | ||
| 2010 | 0.0 | 0.0 | 0.0 | 0.0 | 0.0 | 0.0 | 0.0 | 0.0 | 0.0 | 0.0 | 0.0 | 0.0 | 0.0 | 0.0 | 0.0 | 0.0 | 0.0 | ||
| 2009 | 0.0 | 0.0 | 0.0 | 0.0 | 0.0 | 0.0 | 0.1 | 0.0 | 0.0 | 0.0 | 0.0 | 0.0 | 0.0 | 0.0 | 0.0 | 0.0 | 0.0 | ||
| 2008 | 0.0 | 0.0 | 0.0 | 0.0 | 0.0 | 0.0 | 0.1 | 0.0 | 0.0 | 0.0 | 0.0 | 0.0 | 0.0 | 0.0 | 0.0 | 0.0 | 0.0 | ||
| 2007 | 0.0 | 0.0 | 0.0 | 0.0 | 0.0 | 0.0 | 0.1 | 0.2 | 0.0 | 0.0 | 0.0 | 0.0 | 0.0 | 0.0 | 0.1 | 0.0 | 0.0 | ||
| 2006 | 0.0 | 0.0 | 0.0 | 0.0 | 0.0 | 0.0 | 0.0 | 0.1 | 0.0 | 0.0 | 0.0 | 0.0 | 0.0 | 0.0 | 0.0 | 0.0 | 0.0 | ||
| 2005 | 0.0 | 0.0 | 0.0 | 0.0 | 0.0 | 0.0 | 0.0 | 0.0 | 0.0 | 0.0 | 0.0 | 0.0 | 0.0 | 0.0 | 0.0 | 0.0 | 0.0 | ||
| 2004 | 0.0 | 0.0 | 0.0 | 0.0 | 0.0 | 0.0 | 0.1 | 0.0 | 0.0 | 0.0 | 0.0 | 0.0 | 0.0 | 0.0 | 0.0 | 0.0 | 0.0 | ||
| 2003 | 0.0 | 0.0 | 0.0 | 0.0 | 0.0 | 0.0 | 0.0 | 0.0 | 0.0 | 0.0 | 0.0 | 0.0 | 0.0 | 0.0 | 0.0 | 0.0 | 0.0 | ||
| 2002 | 0.0 | 0.0 | 0.0 | 0.0 | 0.0 | 0.0 | 0.0 | 0.0 | 0.0 | 0.0 | 0.0 | 0.0 | 0.0 | 0.0 | 0.0 | 0.0 | 0.0 | ||
| 2001 | 0.0 | 0.0 | 0.0 | 0.0 | 0.0 | 0.0 | 0.0 | 0.0 | 0.0 | 0.0 | 0.0 | 0.0 | 0.0 | 0.0 | 0.0 | 0.0 | 0.0 | ||
| 2000 | 0.0 | 0.0 | 0.0 | 0.0 | 0.0 | 0.0 | 0.0 | 0.0 | 0.0 | 0.0 | 0.0 | 0.0 | 0.0 | 0.0 | 0.0 | 0.0 | 0.0 | ||
| 1999 | 0.0 | 0.0 | 0.0 | 0.0 | 0.1 | 0.0 | 0.1 | 0.0 | 0.0 | 0.0 | 0.0 | 0.0 | 0.0 | 0.0 | 0.0 | 0.0 | 0.0 | ||
| 1998 | 0.0 | 0.0 | 0.0 | 0.0 | 0.0 | 0.0 | 0.0 | 0.1 | 0.0 | 0.0 | 0.0 | 0.0 | 0.0 | 0.0 | 0.0 | 0.0 | 0.0 | ||
| 1997 | 0.0 | 0.0 | 0.0 | 0.0 | 0.0 | 0.0 | 0.1 | 0.0 | 0.0 | 0.0 | 0.0 | 0.0 | 0.0 | 0.0 | 0.0 | 0.0 | 0.0 | ||
| 1996 | 0.0 | 0.0 | 0.0 | 0.0 | 0.0 | 0.0 | 0.1 | 0.0 | 0.1 | 0.0 | 0.0 | 0.0 | 0.0 | 0.0 | 0.0 | 0.0 | 0.0 | ||
| 1995 | 0.0 | 0.0 | 0.0 | 0.0 | 0.0 | 0.0 | 0.1 | 0.0 | 0.0 | 0.0 | 0.0 | 0.0 | 0.0 | 0.0 | 0.1 | 0.0 | 0.0 | ||
| 1994 | 0.0 | 0.0 | 0.0 | 0.0 | 0.0 | 0.0 | 0.0 | 0.1 | 0.0 | 0.0 | 0.0 | 0.0 | 0.0 | 0.0 | 0.0 | 0.0 | 0.0 | ||
| 1993 | 0.0 | 0.0 | 0.0 | 0.0 | 0.0 | 0.0 | 0.3 | 0.0 | 0.3 | 0.0 | 0.0 | 0.0 | 0.0 | 0.0 | 0.1 | 0.1 | 0.1 | ||
| 1992 | 0.0 | 0.0 | 0.0 | 0.0 | 0.0 | 0.0 | 0.0 | 0.0 | 0.1 | 0.1 | 0.0 | 0.0 | 0.0 | 0.0 | 0.0 | 0.0 | 0.0 | ||
| 1991 | 0.0 | 0.0 | 0.0 | 0.0 | 0.1 | 0.0 | 0.0 | 0.3 | 0.0 | 0.1 | 0.0 | 0.0 | 0.0 | 0.0 | 0.1 | 0.0 | 0.0 | ||
| 1990 | 0.0 | 0.0 | 0.0 | 0.0 | 0.1 | 0.0 | 0.0 | 0.0 | 0.0 | 0.0 | 0.0 | 0.0 | 0.0 | 0.0 | 0.0 | 0.0 | 0.0 | ||
| 1989 | 0.0 | 0.0 | 0.0 | 0.0 | 0.0 | 0.1 | 0.1 | 0.1 | 0.1 | 0.0 | 0.0 | 0.0 | 0.0 | 0.0 | 0.1 | 0.0 | 0.0 | ||
| 1988 | 0.0 | 0.0 | 0.0 | 0.0 | 0.0 | 0.0 | 0.1 | 0.1 | 0.0 | 0.0 | 0.0 | 0.0 | 0.0 | 0.0 | 0.0 | 0.0 | 0.0 | ||
| 1987 | 0.0 | 0.0 | 0.0 | 0.0 | 0.0 | 0.0 | 0.0 | 0.1 | 0.1 | 0.0 | 0.0 | 0.0 | 0.0 | 0.0 | 0.0 | 0.0 | 0.0 | ||
| 1986 | 0.0 | 0.0 | 0.0 | 0.0 | 0.0 | 0.0 | 0.0 | 0.0 | 0.1 | 0.0 | 0.0 | 0.0 | 0.0 | 0.0 | 0.0 | 0.0 | 0.0 | ||
| 1985 | 0.0 | 0.0 | 0.0 | 0.0 | 0.0 | 0.0 | 0.0 | 0.0 | 0.0 | 0.0 | 0.0 | 0.0 | 0.0 | 0.0 | 0.0 | 0.0 | 0.0 | ||
| 1984 | 0.0 | 0.0 | 0.0 | 0.0 | 0.0 | 0.0 | 0.0 | 0.0 | 0.1 | 0.0 | 0.0 | 0.0 | 0.0 | 0.0 | 0.0 | 0.0 | 0.0 | ||
| 1983 | 0.0 | 0.0 | 0.0 | 0.0 | 0.0 | 0.0 | 0.0 | 0.0 | 0.0 | - | 0.0 | 0.0 | 0.0 | 0.0 | 0.0 | 0.0 | 0.0 | ||
| 1982 | - | 0.0 | - | 0.0 | 0.0 | 0.0 | - | 0.0 | - | 0.0 | - | 0.0 | 0.0 | 0.0 | 0.0 | 0.0 | 0.0 | ||
Reporting rates
Reporting rate is the proportion of all surveys in which the species was present.
Reporting rate by year
This chart shows the reporting rate of Rufous Fantail each year between 1982 and 2017. 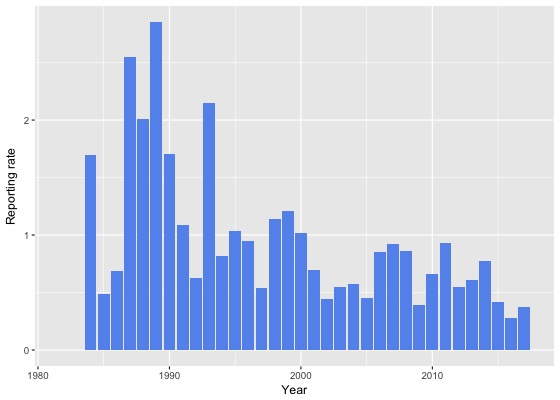
Reporting rate by month
This chart shows the reporting rate by month of Rufous Fantail. The blue lines show the reporting rate for the twelve months to June 2017 and the bars show the average reporting rate for the period 1982 to 2017. 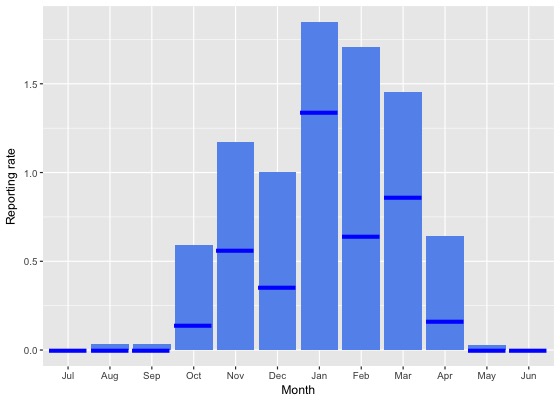
Reporting rate by season
This chart shows the seasonal reporting rate of Rufous Fantail. The blue lines show the seasonal reporting rate for the twelve months to June 2017 and the bars show the average seasonal reporting rate for the period 1982 to 2017. 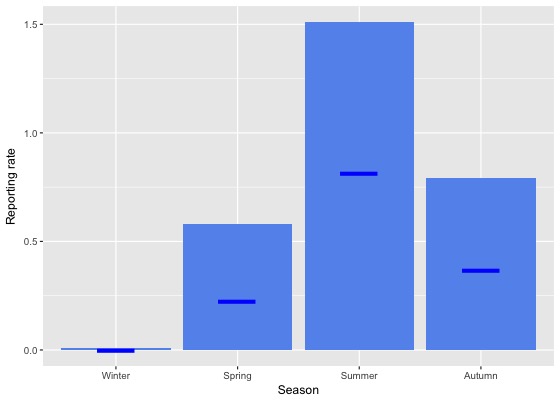
Reporting rate data
| Month | Season | ||||||||||||||||||
|---|---|---|---|---|---|---|---|---|---|---|---|---|---|---|---|---|---|---|---|
| Period | Jul | Aug | Sep | Oct | Nov | Dec | Jan | Feb | Mar | Apr | May | Jun | Winter | Spring | Summer | Autumn | All | ||
| All years | |||||||||||||||||||
| All | 0.0 | 0.0 | 0.0 | 0.6 | 1.2 | 1.0 | 1.8 | 1.7 | 1.5 | 0.6 | 0.0 | 0.0 | 0.0 | 0.6 | 1.5 | 0.8 | 0.8 | ||
| Previous years | |||||||||||||||||||
| All previous years | 0.0 | 0.0 | 0.0 | 0.7 | 1.3 | 1.1 | 1.9 | 1.9 | 1.6 | 0.7 | 0.0 | 0.0 | 0.0 | 0.6 | 1.6 | 0.9 | 0.8 | ||
| Previous 30 years | 0.0 | 0.0 | 0.0 | 0.7 | 1.3 | 1.1 | 2.0 | 2.0 | 1.5 | 0.7 | 0.0 | 0.0 | 0.0 | 0.6 | 1.7 | 0.8 | 0.8 | ||
| Previous 20 years | 0.0 | 0.0 | 0.0 | 0.6 | 0.8 | 0.7 | 1.6 | 1.5 | 0.9 | 0.6 | 0.0 | 0.0 | 0.0 | 0.5 | 1.2 | 0.6 | 0.6 | ||
| 10 year groups | |||||||||||||||||||
| [2007,2017) | 0.0 | 0.0 | 0.0 | 0.5 | 0.4 | 0.6 | 1.5 | 1.3 | 0.8 | 0.5 | 0.0 | 0.0 | 0.0 | 0.4 | 1.2 | 0.5 | 0.6 | ||
| [1997,2007) | 0.0 | 0.0 | 0.0 | 0.8 | 1.4 | 0.8 | 1.8 | 1.8 | 1.1 | 0.8 | 0.0 | 0.0 | 0.0 | 0.7 | 1.4 | 0.7 | 0.7 | ||
| [1987,1997) | 0.0 | 0.1 | 0.0 | 1.2 | 3.0 | 3.4 | 4.0 | 4.4 | 4.7 | 1.3 | 0.2 | 0.0 | 0.0 | 1.5 | 3.9 | 2.1 | 1.8 | ||
| 5 year groups | |||||||||||||||||||
| [2012,2017) | 0.0 | 0.0 | 0.0 | 0.3 | 0.3 | 0.5 | 1.2 | 1.1 | 0.8 | 0.6 | 0.0 | 0.0 | 0.0 | 0.2 | 1.0 | 0.5 | 0.5 | ||
| [2007,2012) | 0.0 | 0.2 | 0.2 | 0.9 | 0.8 | 1.0 | 2.6 | 2.2 | 0.8 | 0.4 | 0.0 | 0.0 | 0.0 | 0.7 | 1.8 | 0.5 | 0.8 | ||
| [2002,2007) | 0.0 | 0.0 | 0.0 | 1.1 | 0.9 | 0.5 | 1.7 | 1.4 | 0.7 | 0.9 | 0.0 | 0.0 | 0.0 | 0.7 | 1.1 | 0.6 | 0.6 | ||
| [1997,2002) | 0.0 | 0.0 | 0.1 | 0.4 | 1.9 | 1.3 | 2.0 | 2.3 | 1.8 | 0.6 | 0.0 | 0.0 | 0.0 | 0.8 | 1.8 | 1.0 | 0.9 | ||
| [1992,1997) | 0.0 | 0.2 | 0.0 | 0.8 | 1.0 | 1.2 | 2.6 | 1.4 | 4.3 | 0.9 | 0.3 | 0.0 | 0.1 | 0.6 | 1.8 | 1.9 | 1.1 | ||
| [1987,1992) | 0.0 | 0.0 | 0.0 | 1.4 | 4.0 | 4.3 | 4.8 | 5.5 | 4.9 | 1.6 | 0.1 | 0.0 | 0.0 | 1.9 | 4.9 | 2.2 | 2.2 | ||
| Year | |||||||||||||||||||
| 2017 | 0.0 | 0.0 | 0.0 | 0.1 | 0.6 | 0.4 | 1.3 | 0.6 | 0.9 | 0.2 | 0.0 | 0.0 | 0.0 | 0.2 | 0.8 | 0.4 | 0.4 | ||
| 2016 | 0.0 | 0.0 | 0.0 | 0.2 | 0.3 | 0.0 | 0.8 | 0.9 | 0.4 | 0.4 | 0.0 | 0.0 | 0.0 | 0.1 | 0.6 | 0.3 | 0.3 | ||
| 2015 | 0.0 | 0.0 | 0.0 | 0.0 | 0.2 | 0.3 | 1.4 | 1.1 | 0.7 | 0.8 | 0.0 | 0.0 | 0.0 | 0.0 | 1.0 | 0.5 | 0.4 | ||
| 2014 | 0.0 | 0.0 | 0.0 | 0.8 | 0.0 | 0.7 | 1.9 | 1.4 | 1.8 | 0.3 | 0.0 | 0.0 | 0.0 | 0.4 | 1.5 | 0.9 | 0.8 | ||
| 2013 | 0.0 | 0.0 | 0.0 | 0.0 | 0.8 | 0.5 | 1.3 | 1.8 | 1.2 | 0.9 | 0.0 | 0.0 | 0.0 | 0.2 | 1.1 | 0.9 | 0.6 | ||
| 2012 | 0.0 | 0.0 | 0.0 | 0.5 | 0.5 | 1.6 | 1.1 | 0.5 | 0.9 | 0.6 | 0.0 | 0.0 | 0.0 | 0.4 | 1.2 | 0.6 | 0.5 | ||
| 2011 | 0.0 | 0.0 | 0.0 | 1.8 | 0.0 | 0.6 | 2.7 | 2.3 | 0.9 | 0.9 | 0.0 | 0.0 | 0.0 | 1.0 | 1.8 | 0.7 | 0.9 | ||
| 2010 | 0.0 | 0.0 | 0.0 | 0.4 | 1.4 | 2.2 | 1.4 | 1.2 | 0.4 | 0.4 | 0.0 | 0.0 | 0.0 | 0.5 | 1.8 | 0.3 | 0.7 | ||
| 2009 | 0.0 | 1.0 | 0.0 | 0.6 | 0.4 | 0.0 | 2.0 | 0.8 | 0.5 | 0.0 | 0.0 | 0.0 | 0.2 | 0.4 | 0.9 | 0.2 | 0.4 | ||
| 2008 | 0.0 | 0.0 | 0.4 | 1.5 | 1.3 | 0.5 | 4.0 | 0.9 | 0.5 | 0.6 | 0.0 | 0.0 | 0.0 | 1.2 | 1.5 | 0.5 | 0.9 | ||
| 2007 | 0.0 | 0.0 | 0.4 | 0.0 | 0.7 | 1.3 | 3.1 | 5.2 | 1.7 | 0.0 | 0.0 | 0.0 | 0.0 | 0.2 | 2.7 | 0.7 | 0.9 | ||
| 2006 | 0.0 | 0.0 | 0.0 | 1.5 | 0.0 | 0.0 | 2.8 | 3.0 | 0.3 | 2.7 | 0.0 | 0.0 | 0.0 | 0.8 | 1.8 | 0.9 | 0.9 | ||
| 2005 | 0.0 | 0.0 | 0.0 | 0.6 | 1.4 | 0.4 | 2.1 | 1.1 | 0.9 | 0.0 | 0.0 | 0.0 | 0.0 | 0.5 | 1.0 | 0.3 | 0.5 | ||
| 2004 | 0.0 | 0.0 | 0.0 | 2.3 | 1.2 | 0.5 | 2.4 | 0.0 | 0.0 | 0.5 | 0.0 | 0.0 | 0.0 | 1.1 | 1.0 | 0.2 | 0.6 | ||
| 2003 | 0.0 | 0.0 | 0.0 | 1.0 | 0.9 | 0.4 | 0.7 | 1.1 | 1.3 | 0.5 | 0.0 | 0.0 | 0.0 | 0.6 | 0.7 | 0.7 | 0.5 | ||
| 2002 | 0.0 | 0.0 | 0.0 | 0.0 | 1.0 | 0.9 | 0.0 | 1.3 | 0.9 | 0.6 | 0.0 | 0.0 | 0.0 | 0.3 | 0.8 | 0.6 | 0.4 | ||
| 2001 | 0.0 | 0.0 | 0.0 | 0.0 | 1.7 | 1.8 | 1.0 | 1.0 | 1.5 | 1.0 | 0.0 | 0.0 | 0.0 | 0.4 | 1.3 | 1.0 | 0.7 | ||
| 2000 | 0.0 | 0.0 | 0.0 | 0.4 | 1.9 | 1.7 | 1.2 | 1.9 | 2.4 | 0.9 | 0.0 | 0.0 | 0.0 | 0.8 | 1.6 | 1.4 | 1.0 | ||
| 1999 | 0.0 | 0.0 | 0.6 | 0.0 | 2.6 | 1.2 | 3.6 | 5.0 | 1.1 | 0.5 | 0.0 | 0.0 | 0.0 | 1.0 | 3.2 | 0.5 | 1.2 | ||
| 1998 | 0.0 | 0.0 | 0.0 | 2.2 | 2.7 | 0.0 | 1.5 | 3.8 | 2.2 | 0.0 | 0.0 | 0.0 | 0.0 | 1.5 | 1.3 | 1.3 | 1.1 | ||
| 1997 | 0.0 | 0.0 | 0.0 | 0.0 | 0.9 | 0.0 | 5.9 | 0.0 | 2.5 | 0.0 | 0.0 | 0.0 | 0.0 | 0.3 | 1.4 | 0.5 | 0.5 | ||
| 1996 | 0.0 | 0.0 | 0.0 | 0.0 | 0.9 | 1.0 | 1.9 | 2.4 | 2.9 | 1.6 | 0.0 | 0.0 | 0.0 | 0.3 | 1.7 | 1.8 | 0.9 | ||
| 1995 | 0.0 | 0.0 | 0.0 | 1.2 | 1.8 | 2.3 | 4.4 | 0.0 | 1.0 | 0.8 | 0.0 | 0.0 | 0.0 | 1.1 | 2.7 | 0.7 | 1.0 | ||
| 1994 | 0.0 | 1.3 | 0.0 | 1.2 | 1.5 | 0.0 | 1.5 | 3.4 | 1.1 | 0.0 | 0.0 | 0.0 | 0.5 | 1.0 | 1.7 | 0.3 | 0.8 | ||
| 1993 | 0.0 | 0.0 | 0.0 | 0.0 | 0.0 | 0.0 | 4.1 | 0.0 | 14.8 | 1.7 | 1.3 | 0.0 | 0.0 | 0.0 | 1.6 | 6.4 | 2.2 | ||
| 1992 | 0.0 | 0.0 | 0.0 | 1.1 | 0.0 | 1.6 | 0.0 | 0.0 | 2.8 | 1.7 | 0.0 | 0.0 | 0.0 | 0.4 | 0.6 | 1.5 | 0.6 | ||
| 1991 | 0.0 | 0.0 | 0.0 | 1.0 | 3.1 | 1.4 | 1.8 | 4.0 | 1.6 | 1.7 | 0.0 | 0.0 | 0.0 | 1.4 | 2.2 | 1.1 | 1.1 | ||
| 1990 | 0.0 | 0.0 | 0.0 | 4.1 | 5.6 | 2.8 | 4.2 | 0.0 | 2.3 | 2.4 | 1.4 | 0.0 | 0.0 | 3.4 | 2.3 | 2.0 | 1.7 | ||
| 1989 | 0.0 | 0.0 | 0.0 | 0.8 | 4.5 | 7.0 | 5.3 | 7.7 | 7.2 | 2.1 | 0.0 | 0.0 | 0.0 | 1.6 | 6.7 | 3.2 | 2.8 | ||
| 1988 | 0.0 | 0.0 | 0.0 | 2.0 | 2.8 | 3.6 | 5.5 | 5.1 | 4.5 | 1.6 | 0.0 | 0.0 | 0.0 | 1.8 | 4.7 | 2.0 | 2.0 | ||
| 1987 | 0.0 | 0.0 | 0.0 | 0.8 | 4.5 | 3.8 | 4.6 | 5.8 | 5.3 | 0.8 | 0.0 | 0.0 | 0.0 | 2.0 | 4.8 | 1.9 | 2.5 | ||
| 1986 | 0.0 | 0.0 | 0.0 | 0.0 | 2.1 | 0.0 | 0.0 | 0.0 | 6.5 | 0.0 | 0.0 | 0.0 | 0.0 | 0.7 | 0.0 | 1.8 | 0.7 | ||
| 1985 | 0.0 | 0.0 | 0.0 | 0.0 | 0.0 | 1.7 | 0.0 | 0.0 | 9.1 | 0.0 | 0.0 | 0.0 | 0.0 | 0.0 | 1.2 | 2.5 | 0.5 | ||
| 1984 | 0.0 | 0.0 | 0.0 | 0.0 | 0.0 | 0.0 | 0.0 | 0.0 | 11.1 | 2.9 | 0.0 | 0.0 | 0.0 | 0.0 | 0.0 | 4.3 | 1.7 | ||
| 1983 | 0.0 | 0.0 | 0.0 | 0.0 | 0.0 | 0.0 | 0.0 | 0.0 | 0.0 | - | 0.0 | 0.0 | 0.0 | 0.0 | 0.0 | 0.0 | 0.0 | ||
| 1982 | - | 0.0 | - | 0.0 | 0.0 | 0.0 | - | 0.0 | - | 0.0 | - | 0.0 | 0.0 | 0.0 | 0.0 | 0.0 | 0.0 | ||
Breeding data
Breeding records by month
Number of breeding records by breeding code and month, 2017 and all years| Breeding code | Jul | Aug | Sep | Oct | Nov | Dec | Jan | Feb | Mar | Apr | May | Jun |
|---|---|---|---|---|---|---|---|---|---|---|---|---|
| 2017 | ||||||||||||
| Breeding (BLA code) | 0 | 0 | 0 | 0 | 0 | 0 | 0 | 0 | 0 | 0 | 0 | 0 |
| Carrying Food | 0 | 0 | 0 | 0 | 0 | 0 | 0 | 0 | 0 | 0 | 0 | 0 |
| Copulating | 0 | 0 | 0 | 0 | 0 | 0 | 0 | 0 | 0 | 0 | 0 | 0 |
| Display | 0 | 0 | 0 | 0 | 0 | 0 | 0 | 0 | 0 | 0 | 0 | 0 |
| Dependent young | 0 | 0 | 0 | 0 | 0 | 0 | 0 | 0 | 1 | 0 | 0 | 0 |
| Faecal sac | 0 | 0 | 0 | 0 | 0 | 0 | 0 | 0 | 0 | 0 | 0 | 0 |
| Inspecting hollow | 0 | 0 | 0 | 0 | 0 | 0 | 0 | 0 | 0 | 0 | 0 | 0 |
| Nest building | 0 | 0 | 0 | 0 | 0 | 0 | 0 | 0 | 0 | 0 | 0 | 0 |
| Nest with eggs | 0 | 0 | 0 | 0 | 0 | 0 | 0 | 0 | 0 | 0 | 0 | 0 |
| Nest with young | 0 | 0 | 0 | 0 | 0 | 0 | 0 | 0 | 0 | 0 | 0 | 0 |
| On/leaving nest | 0 | 0 | 0 | 0 | 0 | 0 | 0 | 1 | 0 | 0 | 0 | 0 |
| All years | ||||||||||||
| Breeding (BLA code) | 0 | 0 | 0 | 0 | 0 | 0 | 0 | 0 | 0 | 0 | 0 | 0 |
| Carrying Food | 0 | 0 | 0 | 0 | 0 | 0 | 1 | 0 | 0 | 0 | 0 | 0 |
| Copulating | 0 | 0 | 0 | 0 | 0 | 0 | 0 | 0 | 0 | 0 | 0 | 0 |
| Display | 0 | 0 | 0 | 0 | 0 | 0 | 0 | 0 | 0 | 0 | 0 | 0 |
| Dependent young | 0 | 0 | 0 | 0 | 0 | 0 | 2 | 2 | 4 | 0 | 0 | 0 |
| Faecal sac | 0 | 0 | 0 | 0 | 0 | 0 | 0 | 0 | 0 | 0 | 0 | 0 |
| Inspecting hollow | 0 | 0 | 0 | 0 | 0 | 0 | 0 | 0 | 0 | 0 | 0 | 0 |
| Nest building | 0 | 0 | 0 | 0 | 0 | 0 | 0 | 0 | 0 | 0 | 0 | 0 |
| Nest with eggs | 0 | 0 | 0 | 0 | 0 | 0 | 0 | 1 | 0 | 0 | 0 | 0 |
| Nest with young | 0 | 0 | 0 | 0 | 0 | 0 | 0 | 0 | 0 | 0 | 0 | 0 |
| On/leaving nest | 0 | 0 | 0 | 0 | 0 | 0 | 1 | 1 | 0 | 0 | 0 | 0 |
Breeding records by year
Average number of breeding records per period by breeding code| Period | Breeding (BLA code) | Carrying Food | Copulating | Display | Dependent young | Faecal sac | Inspecting hollow | Nest building | Nest with eggs | Nest with young | On/leaving nest |
|---|---|---|---|---|---|---|---|---|---|---|---|
| All years | |||||||||||
| All | 0.0 | 0.0 | 0.0 | 0.0 | 0.2 | 0.0 | 0.0 | 0.0 | 0.0 | 0.0 | 0.1 |
| Previous years | |||||||||||
| All previous years | 0.0 | 0.0 | 0.0 | 0.0 | 0.2 | 0.0 | 0.0 | 0.0 | 0.0 | 0.0 | 0.0 |
| Previous 30 years | 0.0 | 0.0 | 0.0 | 0.0 | 0.2 | 0.0 | 0.0 | 0.0 | 0.0 | 0.0 | 0.0 |
| Previous 20 years | 0.0 | 0.0 | 0.0 | 0.0 | 0.0 | 0.0 | 0.0 | 0.0 | 0.0 | 0.0 | 0.0 |
| 10 year groups | |||||||||||
| [2007,2017) | 0.0 | 0.0 | 0.0 | 0.0 | 0.0 | 0.0 | 0.0 | 0.0 | 0.0 | 0.0 | 0.0 |
| [1997,2007) | 0.0 | 0.0 | 0.0 | 0.0 | 0.1 | 0.0 | 0.0 | 0.0 | 0.1 | 0.0 | 0.1 |
| [1987,1997) | 0.0 | 0.1 | 0.0 | 0.0 | 0.6 | 0.0 | 0.0 | 0.0 | 0.0 | 0.0 | 0.0 |
| 5 year groups | |||||||||||
| [2012,2017) | 0.0 | 0.0 | 0.0 | 0.0 | 0.0 | 0.0 | 0.0 | 0.0 | 0.0 | 0.0 | 0.0 |
| [2007,2012) | 0.0 | 0.0 | 0.0 | 0.0 | 0.0 | 0.0 | 0.0 | 0.0 | 0.0 | 0.0 | 0.0 |
| [2002,2007) | 0.0 | 0.0 | 0.0 | 0.0 | 0.2 | 0.0 | 0.0 | 0.0 | 0.0 | 0.0 | 0.0 |
| [1997,2002) | 0.0 | 0.0 | 0.0 | 0.0 | 0.0 | 0.0 | 0.0 | 0.0 | 0.2 | 0.0 | 0.2 |
| [1992,1997) | 0.0 | 0.2 | 0.0 | 0.0 | 0.0 | 0.0 | 0.0 | 0.0 | 0.0 | 0.0 | 0.0 |
| [1987,1992) | 0.0 | 0.0 | 0.0 | 0.0 | 1.2 | 0.0 | 0.0 | 0.0 | 0.0 | 0.0 | 0.0 |
| Year | |||||||||||
| 2017 | 0.0 | 0.0 | 0.0 | 0.0 | 1.0 | 0.0 | 0.0 | 0.0 | 0.0 | 0.0 | 1.0 |
| 2016 | 0.0 | 0.0 | 0.0 | 0.0 | 0.0 | 0.0 | 0.0 | 0.0 | 0.0 | 0.0 | 0.0 |
| 2015 | 0.0 | 0.0 | 0.0 | 0.0 | 0.0 | 0.0 | 0.0 | 0.0 | 0.0 | 0.0 | 0.0 |
| 2014 | 0.0 | 0.0 | 0.0 | 0.0 | 0.0 | 0.0 | 0.0 | 0.0 | 0.0 | 0.0 | 0.0 |
| 2013 | 0.0 | 0.0 | 0.0 | 0.0 | 0.0 | 0.0 | 0.0 | 0.0 | 0.0 | 0.0 | 0.0 |
| 2012 | 0.0 | 0.0 | 0.0 | 0.0 | 0.0 | 0.0 | 0.0 | 0.0 | 0.0 | 0.0 | 0.0 |
| 2011 | 0.0 | 0.0 | 0.0 | 0.0 | 0.0 | 0.0 | 0.0 | 0.0 | 0.0 | 0.0 | 0.0 |
| 2010 | 0.0 | 0.0 | 0.0 | 0.0 | 0.0 | 0.0 | 0.0 | 0.0 | 0.0 | 0.0 | 0.0 |
| 2009 | 0.0 | 0.0 | 0.0 | 0.0 | 0.0 | 0.0 | 0.0 | 0.0 | 0.0 | 0.0 | 0.0 |
| 2008 | 0.0 | 0.0 | 0.0 | 0.0 | 0.0 | 0.0 | 0.0 | 0.0 | 0.0 | 0.0 | 0.0 |
| 2007 | 0.0 | 0.0 | 0.0 | 0.0 | 0.0 | 0.0 | 0.0 | 0.0 | 0.0 | 0.0 | 0.0 |
| 2006 | 0.0 | 0.0 | 0.0 | 0.0 | 1.0 | 0.0 | 0.0 | 0.0 | 0.0 | 0.0 | 0.0 |
| 2005 | 0.0 | 0.0 | 0.0 | 0.0 | 0.0 | 0.0 | 0.0 | 0.0 | 0.0 | 0.0 | 0.0 |
| 2004 | 0.0 | 0.0 | 0.0 | 0.0 | 0.0 | 0.0 | 0.0 | 0.0 | 0.0 | 0.0 | 0.0 |
| 2003 | 0.0 | 0.0 | 0.0 | 0.0 | 0.0 | 0.0 | 0.0 | 0.0 | 0.0 | 0.0 | 0.0 |
| 2002 | 0.0 | 0.0 | 0.0 | 0.0 | 0.0 | 0.0 | 0.0 | 0.0 | 0.0 | 0.0 | 0.0 |
| 2001 | 0.0 | 0.0 | 0.0 | 0.0 | 0.0 | 0.0 | 0.0 | 0.0 | 0.0 | 0.0 | 0.0 |
| 2000 | 0.0 | 0.0 | 0.0 | 0.0 | 0.0 | 0.0 | 0.0 | 0.0 | 0.0 | 0.0 | 0.0 |
| 1999 | 0.0 | 0.0 | 0.0 | 0.0 | 0.0 | 0.0 | 0.0 | 0.0 | 0.0 | 0.0 | 1.0 |
| 1998 | 0.0 | 0.0 | 0.0 | 0.0 | 0.0 | 0.0 | 0.0 | 0.0 | 1.0 | 0.0 | 0.0 |
| 1997 | 0.0 | 0.0 | 0.0 | 0.0 | 0.0 | 0.0 | 0.0 | 0.0 | 0.0 | 0.0 | 0.0 |
| 1996 | 0.0 | 0.0 | 0.0 | 0.0 | 0.0 | 0.0 | 0.0 | 0.0 | 0.0 | 0.0 | 0.0 |
| 1995 | 0.0 | 1.0 | 0.0 | 0.0 | 0.0 | 0.0 | 0.0 | 0.0 | 0.0 | 0.0 | 0.0 |
| 1994 | 0.0 | 0.0 | 0.0 | 0.0 | 0.0 | 0.0 | 0.0 | 0.0 | 0.0 | 0.0 | 0.0 |
| 1993 | 0.0 | 0.0 | 0.0 | 0.0 | 0.0 | 0.0 | 0.0 | 0.0 | 0.0 | 0.0 | 0.0 |
| 1992 | 0.0 | 0.0 | 0.0 | 0.0 | 0.0 | 0.0 | 0.0 | 0.0 | 0.0 | 0.0 | 0.0 |
| 1991 | 0.0 | 0.0 | 0.0 | 0.0 | 0.0 | 0.0 | 0.0 | 0.0 | 0.0 | 0.0 | 0.0 |
| 1990 | 0.0 | 0.0 | 0.0 | 0.0 | 1.0 | 0.0 | 0.0 | 0.0 | 0.0 | 0.0 | 0.0 |
| 1989 | 0.0 | 0.0 | 0.0 | 0.0 | 2.0 | 0.0 | 0.0 | 0.0 | 0.0 | 0.0 | 0.0 |
| 1988 | 0.0 | 0.0 | 0.0 | 0.0 | 1.0 | 0.0 | 0.0 | 0.0 | 0.0 | 0.0 | 0.0 |
| 1987 | 0.0 | 0.0 | 0.0 | 0.0 | 2.0 | 0.0 | 0.0 | 0.0 | 0.0 | 0.0 | 0.0 |
| 1986 | 0.0 | 0.0 | 0.0 | 0.0 | 0.0 | 0.0 | 0.0 | 0.0 | 0.0 | 0.0 | 0.0 |
| 1985 | 0.0 | 0.0 | 0.0 | 0.0 | 0.0 | 0.0 | 0.0 | 0.0 | 0.0 | 0.0 | 0.0 |
| 1984 | 0.0 | 0.0 | 0.0 | 0.0 | 0.0 | 0.0 | 0.0 | 0.0 | 0.0 | 0.0 | 0.0 |
| 1983 | 0.0 | 0.0 | 0.0 | 0.0 | 0.0 | 0.0 | 0.0 | 0.0 | 0.0 | 0.0 | 0.0 |
| 1982 | 0.0 | 0.0 | 0.0 | 0.0 | 0.0 | 0.0 | 0.0 | 0.0 | 0.0 | 0.0 | 0.0 |
Distribution map
Distribution - 2017
This map shows the observed distribution of the Rufous Fantail for 2017.
The red circles are the grid cells where Rufous Fantail have been reported.
The transparency of the red circles indicate how many surveys sheets were submitted for that grid cell; the darker the red the more reliable the data. Of the 315 grid cells with reports, 83 had only one sheet; an example is grid number A11.
The size of the circle represents the reporting rate. The maximum reporting rate for Rufous Fantail was 66.7% (eg grid number U21) and the minimum was 0.1% (eg grid number L14). 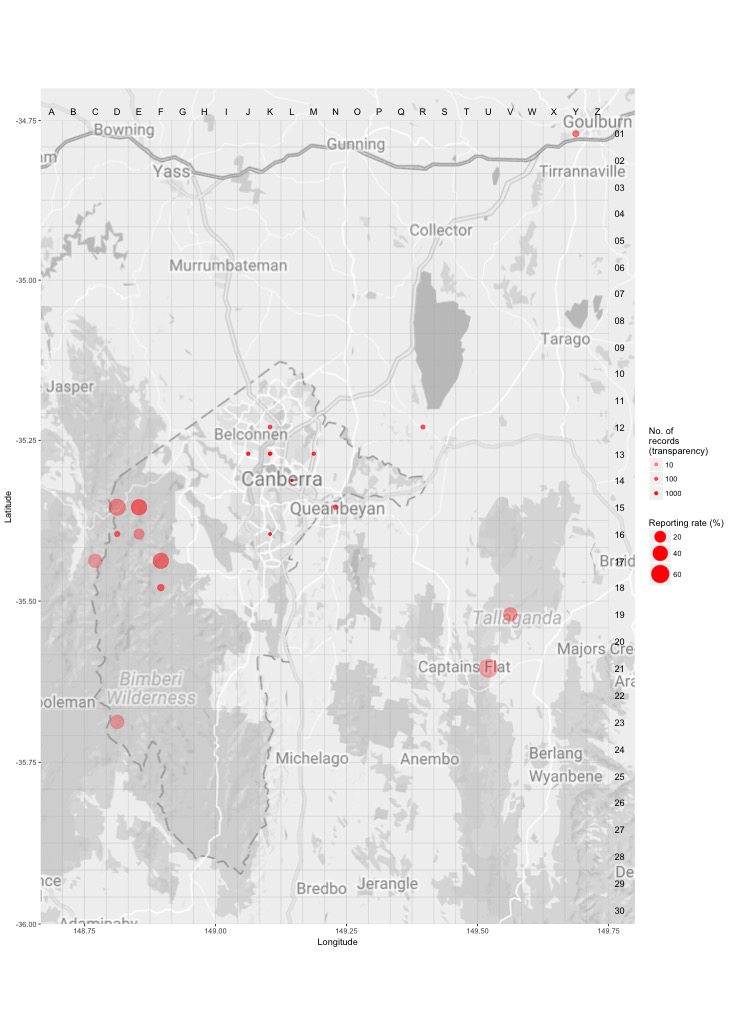
Distribution - all years
This map shows the observed distribution of the Rufous Fantail for all years.
The red circles are the grid cells where Rufous Fantail have been reported.
The transparency of the red circles indicate how many surveys sheets were submitted for that grid cell; the darker the red the more reliable the data. Of the 703 grid cells with reports, 55 had only one sheet; an example is grid number U26.
The size of the circle represents the reporting rate. The maximum reporting rate for Rufous Fantail was 100.0% (eg grid number U26) and the minimum was 0.1% (eg grid number I11). 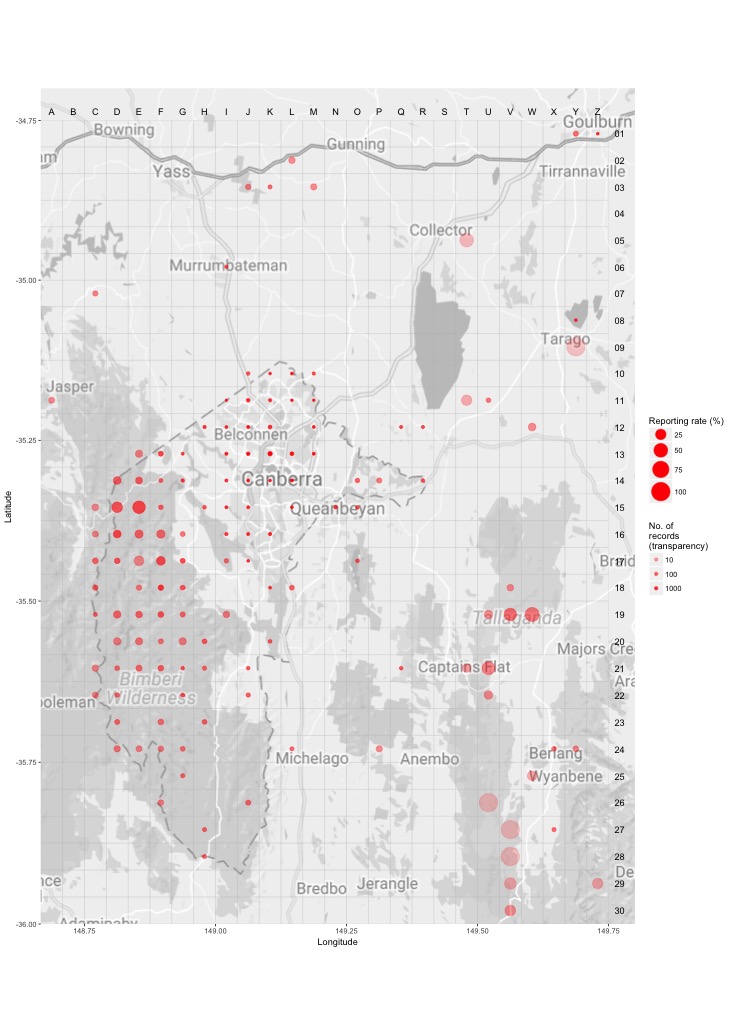
Breeding map
Breeding - 2017
This map shows the breeding distribution of the Rufous Fantail for 2017.
The red circles are the grid cells where breeding activity for Rufous Fantail have been reported.
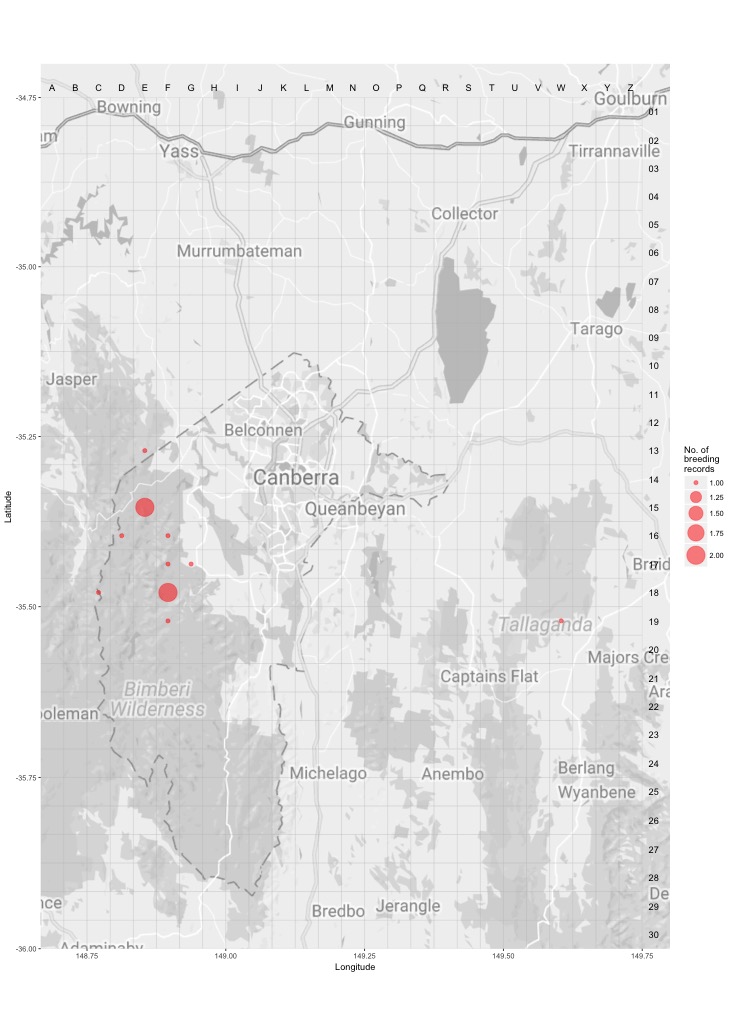
The size of the circle represents the number of reports. 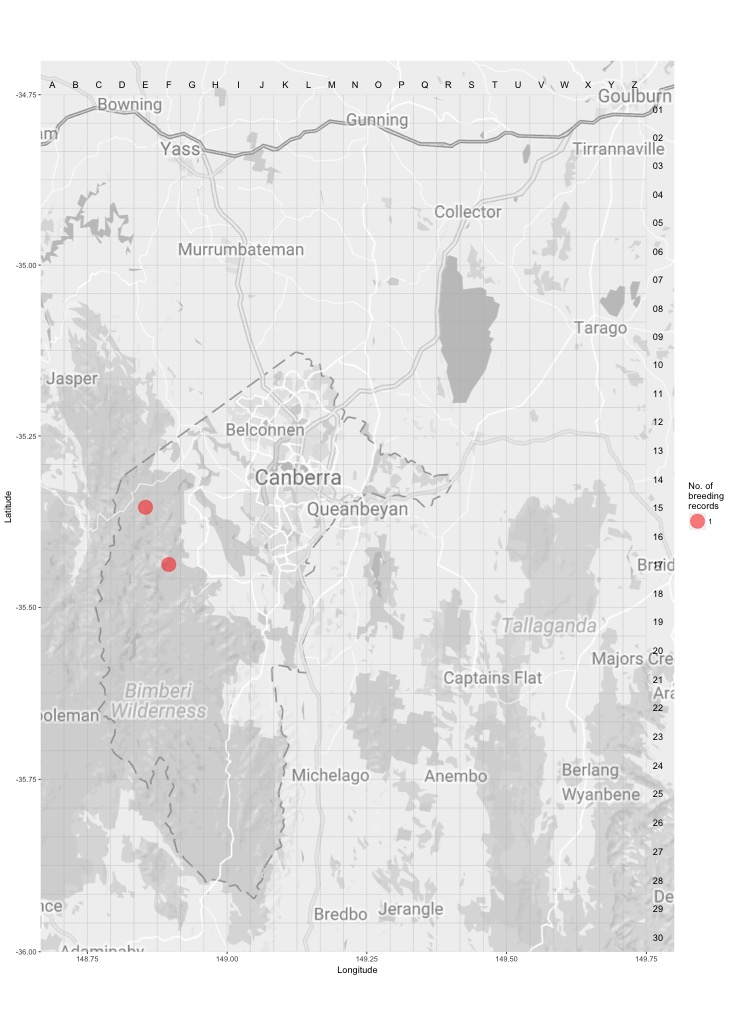
Breeding - all years
This map shows the breeding distribution of the Rufous Fantail for all years.
The red circles are the grid cells where breeding activity for Rufous Fantail have been reported.
The size of the circle represents the number of reports.